Company Profile
Swaraj Engines Limited (SEL) is a Mohali based company originally established to manufacture engines for the erstwhile Punjab Tractors Ltd(PTL).The Company was a joint venture between PTL and Kirloskar Oil Engines Ltd(KOEL).However last year PTL was taken over by Mahindra & Mahindra(M&M) which is the market leader in Tractors(PTL was 3rd). SEL manufactures diesel engines, diesel engine components and spare parts. It supplies 5 types of Engines from 20HP range to 50HP range and also manufactures high-tech engine components for Swaraj Mazda.The Company’s engine business constitutes approximately 93% of its product revenue. The remaining 7% represents value of hi-tech engine components being supplied to SML for assembly of commercial vehicle engines.Let us dig deeper and determine whether SEL makes a good investment or not.
Swaraj Engines Limited (SEL) is a Mohali based company originally established to manufacture engines for the erstwhile Punjab Tractors Ltd(PTL).The Company was a joint venture between PTL and Kirloskar Oil Engines Ltd(KOEL).However last year PTL was taken over by Mahindra & Mahindra(M&M) which is the market leader in Tractors(PTL was 3rd). SEL manufactures diesel engines, diesel engine components and spare parts. It supplies 5 types of Engines from 20HP range to 50HP range and also manufactures high-tech engine components for Swaraj Mazda.The Company’s engine business constitutes approximately 93% of its product revenue. The remaining 7% represents value of hi-tech engine components being supplied to SML for assembly of commercial vehicle engines.Let us dig deeper and determine whether SEL makes a good investment or not.
Balance Sheet Quality
A good business needs to be backed up by a good balance sheet just as a good foundation is required for a huge building.SEL has had a pretty strong balance sheet which has enabled it to weather the ups & downs of the business cycle quite well . The company had about 11.3Crs Debt or D/E of 0.28 in 2000 and was able to go debt free by around 2005. SEL has also managed short term assets and liabilities well having comfortable current ratios over the past 5 years. Also the Cash Conversion Cycle or the amount of time it takes for the company to get cash is -5 & has been negative throughout the 10 year period showing Management effectiveness in managing Creditors,Debtors & Inventory.So in short very little to worry about w.r.t the Balance sheet in the case of SEL. Lets now take a look at how the company has been making money and spending it.
Profitability
Having a good Balance sheet is no good if the company fails to utilize the assets in a productive way to grow sales & profits. Lets first take a look at how much the company spends and retains for each Rupee earned. The pie chart below shows the expenses and profit earned by SEL on average as a percent of sales(Over last 10 years).

As we can see the gross margins are around 22 % & it fell to 18.5% last year owing to rising raw material costs. The main raw material used is steel which is a commodity and its price keeps fluctuating which gets reflected in the gross margins of the company. However SEL has done remarkably well to control these costs & hasn't allowed the margin to fall below 22% over the past 10 years except in 2009 . The net profit margin(NPM) has averaged at about 12% again with 2009 being the worst year with 9.9% . The NPM only tells half the story and only when looked at in conjunction with the Asset Turns do we get the complete picture as to how much the company returns on its assets. Asset turns has averaged about 2 taking the ROA to above 20%+ on average over the past 10 years. The chart below shows the Return on Equity (ROE) & Net Profit Margin(NPM) achieved by SEL over the last decade.

Cash Flow
Cash is King as they say and the cash flows of a company allow us to look at how much cash the company is actually making. Ultimately the company needs cash to pay dividends & reinvest in the business not EPS. A company having impressive sales & profits is no good if its not making any cash or burning cash. First lets look at how the Cash from Operations (CFO) compares with Earnings before Interest Depreciation & Amortization(EBIDA) , this is shown in the chart below (in Crs).

As we can observe the CFO follows the EBIDA reasonably well indicating that the Management hasn't been tinkering with Inventory, receivables & creditors to raise sales. Cash Flows are generally lumpy for most companies as can be seen from the chart whereas earnings are more smoother as companies tend to smoothen them over the business cycle by altering the revenue recognition. So now that we know SEL has had solid positive Cash Flows in the past lets look at how much of this cash the company is able to retain after capital expenditure(CAPEX) or in other words how much Free Cash Flow (FCF) it generates. The Chart below compares the Net profit vs FCF generated by SEL over the past 4 years(Had detailed Cash Flow statement for only last 4 years)(in Crs).

As we can observe the CFO follows the EBIDA reasonably well indicating that the Management hasn't been tinkering with Inventory, receivables & creditors to raise sales. Cash Flows are generally lumpy for most companies as can be seen from the chart whereas earnings are more smoother as companies tend to smoothen them over the business cycle by altering the revenue recognition. So now that we know SEL has had solid positive Cash Flows in the past lets look at how much of this cash the company is able to retain after capital expenditure(CAPEX) or in other words how much Free Cash Flow (FCF) it generates. The Chart below compares the Net profit vs FCF generated by SEL over the past 4 years(Had detailed Cash Flow statement for only last 4 years)(in Crs).
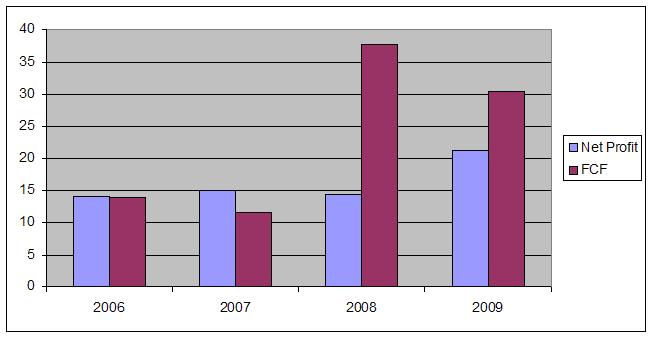
So SEL seems to be generating a good amount of Free cash and well above the net profits in the past 2 years. This is mainly owing to the low capital expenditures the company has incurred over the past few years. I am not sure of why this is so as it isn't evident from the annual report. However now after M&M has taken over we can expect some capacity expansion to happen which could increase the CAPEX many notches & FCF could take a hit. So the business has demonstrated a strong ability to generate good cash flows.
Performance and Management
We now have a fair idea about the Financial Stability,Profitability & Cash generating ability of Swaraj engines.Let us now delve into how SEL's sales & profits have grown over the years. The charts below show the sales & profits acheived by SEL over the last decade.

As is evident from the charts above SEL has had a pretty below average performance both wrt sales & profits between 2000-2009. Sales have grown at 4.6% CAGR & Profits at a disappointing 1.3% CAGR. If we observe carefully we can see that there was a slump in sales from 2000 to 2004-05 & then it picked up from 2005 onwards. However before jumping to conclusions it helps to know that the total tractor sales in India went downwards at 12.5% CAGR during the same period(2000-2004). As most of SEL's revenue came from supplying engines to Swaraj Tractors both the top-line & bottom-line took a hit. I was only able to get data for Tractor sales in India till 2006 & till then SEL had mirrored the movement of total tractor sales. However if we consider the past 5 years,Sales have grown by 18.3% CAGR & Net Profits by 15.5% as shown in the charts above. Further SEL has done well in FY2009-10 ,where Sales increased by 36% to a record 283Crs & net profit was up 76% at 37.4 Crs. So the business really seems to have picked over the past couple of years and actually did quite well even during the recession. The dividend Payout has been very healthy averaging about 48% although it has come down in recent years but still over 30%. The company missed the dividend only once in last 10 years in 2007. Considering the above factors it appears to me the management has done well (and is share holder friendly) to achieve good returns on invested capital although they could have done better on the revenue front.
Valuation
Now that we have looked into the financial statements and past performance of SEL it is time to check whether it is worth buying at current market prices. The simple rule of investing is buy low and sell high and there is no point overpaying for a company no matter how good it may be . I am not going to try and value the company using DCF as i don't feel i have the requisite knowledge of the industry to make the right assumptions.So it would end up being Garbage in Garbage out, thats the reason i shall stick to common used valuation multiples.The table below shows the Price by Earnings, Cash Flow & Book Value of SEL for the Trailing Twelve Months(TTM),normalized 3years & 5years earnings & cash flow.
TTM 3yr Avg 5yr Avg
P/E 10.43(8.4) 16.03(12.9) 19.15(15.41)
P/CF 12.37(9.95) 13.78(11.09) 17.3(13.92)
P/BV 2.9
The values in the parentheses above show the valuation if we subtract 76.2Crs worth cash & investments from the market value or Rs 61.5/sh . So we are getting a zero debt company with average Cash Return on Capital Employed of over 30% for the past 5 years for a single digit P/E & P/BV of around 3. This may not be outright cheap but neither is it fairly valued especially if we look at the competition.
Company MarketCap P/BV(x) P/E(x) Div Yld ROE(%)
Swaraj Engines Ltd 391 2.9 10.4 1.6 23.64
Cummins India Ltd 10,989 7.38 26.5 1.6 32.75
Greaves Cotton Ltd 1,663 4.32 41.4 1.2 11.89
Cummins India Ltd 10,989 7.38 26.5 1.6 32.75
Greaves Cotton Ltd 1,663 4.32 41.4 1.2 11.89
The only competitors i could find were Cummins and Greaves cotton which are both engine manufacturers catering to different sectors though. Its generally a sector that has good margins and ROE and hence generally trade well over 2x of Book Value. So from a relative valuation standpoint also swaraj engines looks much cheaper.
Risks
Let me summarize the risks SEL faces in the following points.
- As Most of SEL's revenue comes from Tractor engines its fortunes are tied to Tractor sales .The tractor industry has a certain cyclical nature and depends heavily upon the general rural economy – investments by the Government, monsoons and availability of credit at affordable rate.
- The main raw material used is steel which is a commodity whose prices are cyclical which directly impacts the margins of the company
- SEL also gets a part of its revenue from engine components of light commercial vehicles(LCV) which is a again a cyclical industry
- Again like IMPAL , this is also an illiquid stock and a smallcap although the Bid- Ask spreads and volatility are lesser than small/micro cap companies but more when compared to mid & large cap companies.
Conclusion
Though i am generally not a macro investor the investment thesis for SEL is more of a bet on the Agriculture sector.The Government has taken several initiatives towards addressing the major needs of the farm sector and to raise rural income. These initiatives include - enhanced credit, accelerated irrigation, marketing of agri-produce, enhancement of minimum support prices, up-gradation of farm technology etc. As a result, in the last six years, tractor market has grown by nearly 90%.Its no wonder then that ace indian investor Rakesh Jhunjhunwala seems to be bullish on the Agriculture sector in this recent interview . India has about 11 crore farmers in the country and roughly 4.5 lakh tractors are sold every year and Tractor population is about 45 lakh. That means for every 22 farmers there is one tractor whereas the world average is 1 tractor for every 5.5 farmers. So there is a good chance that over the next few years the demand for tractors is going to be very buoyant.Also, the takeover by M&M, which is the largest manufacturer of tractors in India and has sustained its market leadership in the Indian tractor market for over 26 years augurs well for SEL. The consolidated market share of the Farm Equipment Sector of M&M is now 40.9% of the domestic market.Swaraj Engines is also going to manufacture engines for the LCVs of Mahindra apart from Swaraj Mazda which will help increase non tractor revenue. Hence keeping the above factors in mind i think SEL makes a good long term bet .


