Sunday, December 5, 2010

Sanghvi Movers


Company Profile  

Sanghvi Movers Ltd. (SML), a flagship company of the Sanghvi Group,operating since 1989, is the largest crane hiring company in India, 3rd  largest in Asia and 9th  largest in the world . It has a fleet of 370 medium to large sized heavy duty hydraulic and crawler cranes with capacity ranging from 20 tons to 800 tons. The crane hiring business is the main business line for the company contributing around 99% of the  turnover . The company also provides basic engineering and lift planning services along, as it helps in determining the time, labor, type of equipment required and flow of work.These cranes are used in the power, refineries, steel, cement and construction sectors, for purposes such as plant erection, heavy lifting and maintenance services.Lets take a closer look at the company to determine whether its worthy of an investment.

Balance Sheet Quality
Sanghvi operates in a capital intensive industry and hence generally sports a high Debt/Equity ratio. The D/E is currently about 1.01 and Debt has grown 10 times in 10 years from 44 crs to the present 470Crs as the company has also grown. The company borrows heavily when the economy is doing well & remains conservative during slower times. Between 2000 - 2004 the D/E was well below 1 , but from 2005 to the present it has remained more than 1 but steadily reducing after peaking to about 3 in 2006. 

The current ratio has remained well above 1 for most years. The Cash Conversion Cycle is a huge negative value as the company has no inventory due to the nature of the business & the large Days Payable Outstanding. I am not sure how useful this metric is for Sanghvi as ideally its should have been a positive value for a capital intensive business. Accounts receivables have grown at 39.7% CAGR which is a worrying sign although Payables have also grown at 41% CAGR.

Profitability
Sanghvi has over the years shifted focus to Higher Tonnage Cranes(>100MT) where competition is lesser and enjoys a dominant market share which enables it to earn good profit margins. The operating profit margins have been in the range of 66-75% in the past 5 years as there are very little expense by the way of maintainence of cranes, transportation & labor charges. The company has also consistently improved its Net profit margin from 13.4% in 2004 to 26.4% in 2010. This has mainly been on account of focus on higher Tonne(100MT+) cranes which have better margins. Asset turns have been on the lower side ranging between 0.47-0.35 in last 5 years touching 0.35 in 2010. This depends on the utilization rates(and lower idle time)of the cranes. The Return on Capital Employed(ROCE) has ranged between 15% - 24% in the last 6 years and has gotten better with improving margins. 


Cash Flow
A look at the trend of Cash Flow from operations (CFO) w.r.t Earnings before Interest,Depreciation & Amortization (EBIDA) between 2000 - 2010 shows that SML has manged strong cash flows  with good working capital management(Further the company has no Inventory due to the nature of the business) & control over Payables & Receivables. 


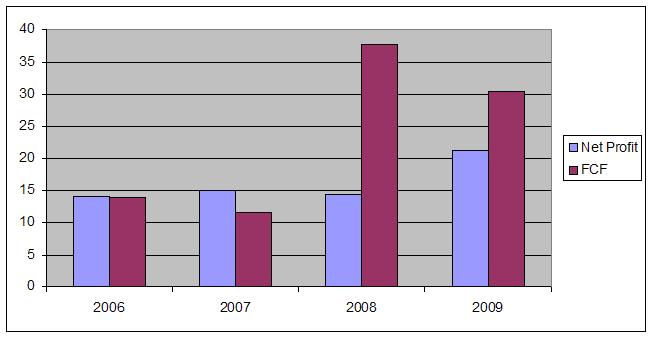
The Cash Return on Capital Employed(CROCE) has been close to the ROCE in most years ranging between 15 - 22% in the past 7 years. Coming to the important metric Free Cash Flow(FCF), SML has had consistent -ve FCF(except 2010) despite strong Cash Flow from Operations mainly due to the Capital Intensive nature of the business. The chart below shows the FCF ,Net Profit & CFO trend over the last 6 years.


Beginning in 2004 upto 2009, Sanghvi undertook aggressive CAPEX plans by purchasing a lot of High Tonnage cranes to capitalize on the Infrastructure boom during the period. Going forward, one can expect similar Capex plans to buy more cranes which will need to be funded by both Internal cash flows & debt. This will need to be watched carefully as the company will need to balance Growth & Balance sheet strength going forward.
 
Performance
SML has managed to grow its sales at 25.7% CAGR over the 10 years 2000 - 2010 and Net profits at 36.5% CAGR during the same period. Much of this growth has come between 2004 - 2009 as can be seen from the chart below. 


The CAGR growth rates over the last 5 & 3 years  in Sales have been 34.5% & 22.9% and in Profits 45.8% & 24.2% respectively.There was Sales & profit De-growth in 2010 mainly due to slowdown in infrastructure activity. The company had a good 2009 despite the Recession mainly as it gets 40%+ of its revenues from the Power Sector which was relatively unaffected. Going forward, with the kind of thrust on Infrastructure growth in India, Sanghvi has good growth visibility to maintain its good performance .

Valuation
At the Current Market Price of Rs 184 , Sanghvi Movers's Market Cap is 798 Crs & Enterprise Value is 1266 Crs. The table below shows the various important valuation metrics for TTM & 3,5,10 Year averages .

                                    TTM           3Yr AVG     5yr AVG    10yrs Avg
          P/E                   8.82               9.06                   11.61              21.88
          P/CF                4.67                6.04                     7.72             18.32
          EV/EBIT      6.84                7.04                    8.77              16.27
          P/BV               1.7              Div Yld         1.63% 

SML appears Cheap on most counts even considering the 3 & 5 Year Averages for a company growing at 25% and with good Margins & ROCE . The only Comparable & Listed competitor is ABG Infralogistics(Caters Specifically to Port Sector) which Trades at a P/E of 26 despite being smaller & inferior to Sanghvi on most counts. 

Strengths
Some of the Positives of Sanghvi Movers that come to my mind are :
  1. Near monopoly in higher capacity cranes : SML focuses on the higher capacity cranes market, since the below 100 MT capacity segment has many players operating in it. SML has approximately 65% market share in the above 100-150 MT crane segment and approximately 80% market share in the above 250 MT crane segment.The margins get better with higher tonnage. The company’s strategy is to deploy a majority of its cranes on a medium to long-term basis. This provides stability to earnings besides increasing utilization rates.
  2. Pan India Presence : SML has a network of 10 depots, which are strategically located to enable it to have a pan India presence. These depots not only reduce costs but also save time spent in transporting cranes from the depot to the site. For transporting Cranes, the company has a fleet of in-house trailers constituting 45 Volvos (100MT) and 35 trailers of 25 MT- 35 MT to reduce dependence on outside transport services. This has enabled  the company  to  reduce costs and save  time  involved  in moving cranes from one location to another.
  3. Thrust on infrastructure to spur demand for cranes : Cranes are an essential component for infrastructure building. With massive investments lined up both by the government and the private sector we can expect the company to benefit from the increased demand. Around 0.5-0.7% of infrastructure spending translates to crane hiring charges.Power, Refineries, Steel, cement and construction sectors are witnessing good growth and have lined up huge capex. This augurs well for the company.
  4. Strong Client base  & Sourcing : SML’s clients are major players in their respective industries. Major clientele of the company under various industry segments include Suzlon,BHEL,Enercon,Reliance etc. SML sources cranes  from major  international  players  like Liebherr  (Germany), Terex Demag (Germany), Manitowoc (USA), American crane & Hoist (USA), Kobelco (Japan), and Kato (Japan). The company has established relations with crane vendors around the world.
  5. Aggressive ramp up in crane capacity : After having aggressively added to its capacity over the last couple of years (total capex of Rs. 896 cr over the last 5 years), SML had, in keeping with the slowing economy, cut down on its capex plans.However, with an improvement in the market, the company is expected to resume its aggressive Capex plans.
Risks 
The Main Risks that Sanghvi Movers faces can be summarized as below:
  1. Customer Concentration : About 40% of the company's revenue comes from the Power Sector & the top 5 clients account for a major chunk of the revenue. Although SML has been able to reduce this dependence by diversifying into Refineries, Cement & Construction, a loss of few main customers can hurt it.
  2. Debt & interest Rates :  Being a capital-intensive industry, the company has funded a major part of its capex via the debt route and a significant hike in interest rates would have an adverse impact on  its profitability. Increase in  interest rates could impact the net profit margins of SML. The company has done well to bring down the D/E from 2.9 in 2006 to about 1 in 2010.
  3. Slowdown in economy  : If the economy slows down , it may lead to curtailment in the capex plans of client companies or in execution which may may lead to a reduction in the utilization rate.In such a situation,one can expect Sanghvi Movers to take a considerable hit on its topline and bottomline. However the company does have some insularity to this due to its major customers being in the power sector as we saw in 2009. 
  4. Competition & Manpower :  Crane renting industry is an unorganized industry with a large number of players. The  less  than 100 MT  capacity  segment  is highly  competitive  and there  are  large number of players. However, in the above 100 MT capacity segment, there are very few players. This is because cranes in this segment are expensive and need highly skilled manpower to operate and maintain.The company's operations may get affected on account of increase in competition in Crane Hiring Business, shortage of trained operators, mechanics and engineers.
  5. FII Shareholding : SML has foreign shareholding of about 34%, which comprises of different institutional investors. These shareholders have been invested in the company for a considerable length of time, which reflects their confidence in SML’s business. However, on the downside, there could be selling pressure when there is a sustained rise in price increasing the stock’s volatility.
Conclusion
Sanghvi Movers in my view is a proxy for the Infrastructure story that is to play out in our country.In the preceding boom in Infrastructure between 2003-2009 ,SML did well to grow its Topline ,Bottomline & improve margins. It would need to repeat that in the coming years while making sure it doesn't take on too much Debt. With history on its side and a reasonable Valuation i believe Sanghvi Movers makes a good long term bet.

Disclosure : Long Sanghvi Movers. Please read the Disclaimer

Wednesday, December 1, 2010

MOIL IPO Analysis

Hello Folks its been a long time since my last post & a lot has happened in the Markets with the Sensex Hitting 21k in diwali & the current correction to 19k levels. I have been very busy with work off late and hence i couldn't post but at the same time i have been looking at  a lot of companies. Hopefully i shall be more active from now on.

Apologies again for my delay in posting this Analysis of MOIL with just 1 day to the close of the Issue.Hopefully it would help some of you who are still confused whether to invest or not. I went through the Prospectus, various research reports & Annual Reports to come of with the following write up.

Company Profile

MOIL, a Miniratna PSU, accounts for nearly 50% of India’s Manganese ore production. Currently, MOIL operates 10 mines located in Maharashtra (six mines) and Madhya Pradesh (four mines). In addition to Manganese ore production, the company has diversified into high value-added products  HCFM and EMD. The company also operates two wind power plants, with total capacity of 20MW, in Nagda hills and Ratedi hills, Madhya Pradesh. 

The IPO entails issue of 3.36cr equity shares priced in the band of  Rs 340–375. The issue of 3.36cr equity shares by the central and state governments represents 20% of the company’s total outstanding share capital. The company will not receive the offer proceeds, as the proceeds are part of the government's divestment plan.

Strengths 
  1. Largest producer of manganese ore in India with access to significant reserves : MOIL accounts for nearly 50% of India’s manganese ore production, distantly followed by Tata Steel (16%), Sandur Manganese (10%) and Rungta mines (7%).  The company holds approximately 17.0% of the proved reserves of manganese ore in India which is 21.7 million tonnes of proved and probable reserves and a total of 69.5 million tonnes of measured, indicated and inferred mineral resources of manganese ore. 55.0% of  MOIL's ore reserves have an average manganese content of 40.0% or higher & 27.5% have an average manganese content of 36.0%-39.9%  & none of the mines produce low grade manganese (i.e., below 30.0% manganese content).  
  2. Well positioned to capture the growth potential of the Indian steel industry : As more than 90% of Manganese world over is used in Steel Making, the fortunes of MOIL have been tied to the domestic steel industry. CARE Research expects domestic steel demand to increase at a 9.2% CAGR over FY2011–15. Thus, demand for manganese ore is expected to increase at a 9.0% CAGR over the next two-three years. This is an indirect way to play the Infrastructure story to unfold in India.MOIL due to its  significant reserves, is well positioned to serve the increase in demand expected from the steel industry.                                                              
  3. Low cost and efficient operations : As the largest producer of manganese ore by volume in India, MOIL is able to achieve economies of scale in procurement of input materials, production efficiency, marketing, sales, and other aspects of its operations. The Dongri Buzurg mine is fully mechanized and all other mines are semi-mechanized. Mechanization allows for higher recovery rates, permitting an increasing percentage of manganese ore to be recovered by way of crushing, screening and sorting of waste, thus improving productivity and higher sales. The company owns all the equipment it uses in its operations and third parties are primarily used for overburden removal. This gives MOIL flexibility in operations as it doesn't depend on third parties for operations.All of the above elements favor cost-efficient production, which increases MOIL's profitability and make it one of the lowest cost producers of Manganese ore. 
  4. Strategic location of mines provides it with advantages : MOIL's mines are located in central India, in the states of Maharashtra and Madhya Pradesh which have well-developed road and rail infrastructure. The central location gives it a marketing advantage over competitors, as it facilitates transportation of products, resulting in lower cost and faster time of delivery for its customers. Also, higher transportation costs associated with imported manganese ore provides MOIL with improved competitive positioning in the market.                                                    
  5. Solid Financials  : MOIL is a debt free Company with 1763 Crs Cash on its books. It benefits from a strong liquidity position that gives it significant flexibility & ability to pursue acquisitions abroad if required. MOIL has enjoyed Healthy Net profit Margins ranging between 43-48% in last 3 years. It also has excellent cash flows & is Free Cash Flow positive.The Company's strong Balance Sheet and cash flows from operations provide it with sufficient resources to fund projects, working capital requirements and maintain a healthy level of cash on its balance sheet.
  6. Strong capabilities for exploration, mine planning and research development :  The company is actively involved in exploration and development activities to increase its proved manganese ore reserves. An area of 814.71 hectares in the State of Maharashtra has been reserved for MOIL by a notification from the Ministry of Mines. It has applied for prospecting licenses with respect to this area. MOIL has a planning division that includes geologists and mining engineers that focuses on exploration activities at potential mineral deposits.
  7. Experienced senior management , large pools of skilled manpower & Stable Staff Cost : MOIL has an experienced management team with an average of over 20 years of experience in the mining industry and skilled employees who possess significant industry experience. It maintains good relations with its employees and unions and has not lost any significant employee time due to strikes or labor unrest for the past 25 years. As compared to other PSUs, MOIL is relatively insulated from volatility in its salary cost, as the wage agreement is effective for a 10-year period. The wage agreement for non-executive employees will expire on July 31, 2017 and that for executive  employees will expire on December 31, 2016 .Employee costs represent the most significant portion of its operating expenses.
  8. Expansion through capacity addition and JVs for Forward Integration : MOIL has undertaken expansion plan at its existing mines to augment its production capacity to 1.5mn tonnes by FY2016E from the current levels of 1.1mn tonnes.  At Balaghat, Gumgaon and Munsar, shaft sinking and deepening of existing shafts is underway. MOIL intends to expand its value-added capacity and, thus, has entered into JVs with SAIL and Rashtriya Ispat Nigam Ltd. (RINL) to set up two ferro-alloy plants in Chhattisgarh and Andhra Pradesh. The proposed installed capacity in case of the JV with SAIL is 1,06,000 tonnes and that in case of RINL is 57,500 tonnes.  The plants are expected to be commissioned by June–July 2012. These capacities will enable MOIL to increase sales of value-added products and also improve margins.
Risks 
  1. Fortunes tied to Steel Industry : The manganese ore industry is highly dependent on the prospects of the steel industry, as 94% of manganese ore produced is used in the production of ferro alloys, which is consumed in the steel industry (90% of ferro alloy produced is used in the steel industry). Manganese ore prices have been very volatile historically and had fallen by more than 50% during the downturn in 2008. Any adverse changes in steel demand can have a negative bearing on manganese ore prices.
  2. Client Concentration Risk : MOIL's top ten customers represent approximately 51.5% of their sales of manganese ore. Key customers include Maharashtra Elektrosmelt Limited and Bhilai Steel Plant (“Bhilai”), which are both subsidiaries of SAIL and which together accounted for 22.1% of sales revenue . If MOIL fails to enter into new agreements on acceptable terms with any of its top ten customers, and SAIL in particular, its results of operations and prospects could be materially and adversely affected. 
  3. Implementation of new mining policy to include 26% profit sharing : To curb illegal mining and fast-track approvals for mining rights, the government has proposed a new bill that requires miners to share 26% of profits with local people affected by their mining projects. Recently, the bill has received an  in-principle approval from the Group of Ministers (GoM) and the proposed bill is expected to be placed in the parliament for approval during the upcoming winter session. Although the proposed bill lacks clarity, the implications of the new profit-sharing rule on MOIL’s earnings could be severe.
  4. Limited mine life for some of the operating mines : The reserves at Kandri, Beldongri, Chikla and Tirodi are expected to exhaust in the next 6–9 years based on FY2010 production levels. These mines produced 32.5% of the total manganese ore in FY2010. Thus, in the absence of any significant reserves accretion at the existing or new mines, the company’s performance could be affected in the long term.
  5. Other Mining Related Risks : Mining operations are subject to a number of operating risks like poor mining conditions resulting from geological, hydrologic or other conditions; adverse weather and natural disasters, such as heavy rains, flooding and other natural events affecting operations,  safety and environmental regulations or changes in interpretation or implementation of current regulations.Seven of the mines MOIL currently operates are underground mines.Underground mining activities are inherently risky and hazardous and prone to fires and explosions.

Financial Performance

MOIL Registered an Impressive Growth in Sales & profits of 22.9% CAGR & 41.8% CAGR respectively from 2001 - 2010 . The chart below shows the trend of Sales & Net Profit Growth. As we can see the growth has been lumpy & the Net profits have gone up significantly since 2005 mainly on account of higher Margins. The Topline grew by 23.% CAGR in past 5 years & 37.7% in past 3 years showing how good the recent years have been for MOIL. Similarly ,the net profits grew by 29.7% CAGR & 52.5% CAGR in last 5 & 3 years respectively.


This can be understood better when looked at with the physical production of Manganese ore & the Cost realization(`000)/Tonne as shown in the chart below from 2001-2010.While the Managnese production grew by just 5.9% CAGR the Price/tonne went up by 24.03% CAGR during the same period. MOIL due to its dominance & quality ore made most of this boom. However the demand grew so much that India was a net Importer of Manganese in the last 3 years.


MOIL being one of the lowest cost producers of Manganese in the world ,has very high Net Profit Margins & Return in Equity(ROE) as shown in the chart below. However between 2001 - 2004 the NPM was just around 9 - 12% but Jumped to 31% in 2005 & has stayed between 31-48% between 2005-2010. The ROE has stayed between 28-59% during the same period. This was mainly on account of better price/tonne as shown above & improved efficiency.


I had the cash flow data of MOIL for only the past 5 years during which it exhibited excellent cash flows and healthy Free cash flow. The chart below shows the Free Cash Flows and net profits between 2006-2010. With the kind of Free cash  MOIL has been able to generate one can be rest assured that it will have no problems paying dividends & the cash balance is likely to grow in the future .


Valuation

Considering the amazing response the Issue has already seen its safe to assume that the price will be fixed at upper band of Rs 375 which translates to a price of Rs 356.25 for Retail Investors after the 5% discount. This translates to a Market Cap of 5985 Crs,however due to the 1763 Crs Cash on books the actual value of the company turns out to be 4222Crs . The table below shows the various important valuation metrics for TTM & 3,5,10 Year averages wherever data was available.

                           TTM          3Yr AVG      5yr AVG     10yrs Avg

          P/E             9.07              7.83               11.34            20.35
          P/CF           16                8.85               12.52
          P/FCF         17               10.11              14.54
          P/BV           2.1
          Div Yld       1.57%

MOIL looks attractively priced whichever way one looks at it on absolute terms. Especially on Trailing Twelve Months(FY10) & 3yrs avg basis it looks quite cheap for a company with such high ROE and growth. Its important to look at average valuations also as this is essentially a commodity company which is cyclical in nature. It looks reasonably priced even w.r.t. 5yr avg considering the  past growth it has had. On a relative basis there is no comparable competitor in India, however MOIL is cheaper than other mining companies like  CIL,NMDC,OMDC,Sandur Manganese etc. Globally, Citic a direct peer of MOIL got listed in November in Hong Kong at a P/E of 42 & P/BV of 7. Further when compared to other Global Mining biggies who have lower margins than MOIL it still appears attractively.

Conclusion

Value Investors generally tend to  ignore IPOs. However as one saw with the IPO of Coal India, fundamentally good companies priced reasonably make for good investments. MOIL i believe fits the bill too what with a  5 star rating from CARE highlighting its fundamental strength and an attractive price. While i am not sure how much listing gains MOIL would fetch but i am confident it makes for a good long term bet.


Disclosure: I have Applied for MOIL IPO. Please read the Disclaimer


Saturday, August 7, 2010

Special Situation - Indo Asian Fuse Gear

I had earlier written a  post on a special situation arising due to the large difference in valuation of DVR & normal shares of Tata Motors & Pantaloon Retail. Recently i have come accross more ideas which fall under the special situation category rather than normal equity long ideas. There is a certain element of unpredictability in special situations which really can't be put into numbers, so you end up making a buy/pass call based on assumptions which themselves may go against you turning your whole analysis wrong. So please go through the following analysis carefully and make your own buy/pass judgments as even i have limited experience with them.

On 23rd July French company Legrand announced that it would buy Indo Asian Fusegears 's Switch gear business for  a sum of 600Crs. The break up of the deal is as follows:
   
     1. Amount to be paid for Switchgear Business : 495 Crs
     2. Amount to be paid as non compete fee : 35 Crs
     3. Amount to be paid as non compete fee to promoters : 35 Crs
     4. Amount to be paid to promoters for Indo Asian Marketing : 35crs

So this works out to 530 Crs to the company(shareholders) and 70 Crs to the promoters . The board of directors of Indo Asian Fusegear has already approved the sale, which is subject to regulatory approvals. Now lets do the math and see how much cash may eventually hit the company's book. 

  Amount paid by legrand to company = 530 Crs
  Tax to be paid to govt.(not sure about the %,assume worst case 30%) = - 159Crs
  Total debt on companies books(as of Mar 2009 ) = -128Crs
  Total cash on companies books(as of Mar 2009) = Rs 13.2Crs
  Remaining Amount with company = 256 Crs or  Rs 167/sh

The company is now available at a Marketcap of 225 Crs (Rs140).The above calculation has a few assumptions like,the debt is as of last years Balance sheet and there is a chance of it going up or down(most likely up). The same argument applies to the cash balance. I have also assumed the worst case Tax at 30% since i am not too sure about this one but there is a chance it can be between 20-30%. So as per my calculations at the current price the market seems to be valuing the company at a 10% discount to its expected cash on books and completely disregarding the remaining business of Indo Asian. Lets take a brief look at the various segments of the company & its financial performance till date to understand why this may be the case.

Indo Asian Fusegear operates in the following business segments:

1. Switchgear : This was the segment that was sold to Legrand for the above mentioned amount.This includes MCBs, HRC Fuses, Feeder Pillars, RCCBs, Distribution Boards, Switches etc. This division had Revenue of 206Crs & Profit of about 31 crs in Fy 2008-09(need latest Annual report for latest figures).

2. Lighting  : This includes Compact Fluorescent Lamps, Fluorescent TubeLights and Luminaires etc. This division had Revenue of 28Crs & Loss of about  2.5crs.

3. Cable and Wires: This includes Wires and Cables etc. This division had Revenue of 26.7Crs & Loss of about  2.25crs.

As its obvious from above, the Switchgear business was the key revenue & profit contributer for Indo Asian a trend visible all the way from 2006-10. The Lighting business was profitable till 2008 & went into losses last year.The Cable & Wires division didn't figure in Annual Reports till 2008 & looks like a new division & it is also loss making. The Lighting business is also very competitive as per the Annual report.  Assuming the Lighting & Cable/wires divisions return to profitability in the near future, we can look at revenues of about 60Crs & profit of about 4-6 Crs(Assumption based on 2008 profits they could very well continue making losses too).  Further the management plans to pursue opportunities in the areas of advance lighting systems (LEDs),  products  for  energy  management  & conservation. This could be the key to its future prospects as getting into Advanced Lighting systems will require the company to make acquisitions or incur Capex all of which will require a good proportion of the cash it will get from the deal. The Management has also said they will consider a special dividend from the proceeds of the sale.

Risks
 
1.First of all, a lot of the figures used in the calculations above especially the balance sheet items are from FY 2008-09 as that is the latest available. The main unknown is the total debt on the company's books. If it turns out to be significantly higher than 128Crs the cash & hence valuation of company reduces.

2.There is uncertainty regarding the prospects of the remaining divisions as to their latest performance. They are mostly loss making going by last year's performance.

3.The management doesn't score very high on corporate governance as per my understanding from the annual report. One of the concerns i found was a lot of Related Party Transactions with the relatives & family members of the promoters. Also the management hasn't paid any dividend till date which implies they may not quite be shareholder friendly.

4.The management hasn't shown anything to write home about w.r.t capital allocation so far. There is a chance that they may pay a small amount as dividend or do a share repurchase & invest the bulk of the cash into new businesses which could lead to value destruction if it doesn't work out.

Conclusion

The market is Valuing Indo Asian Fusegear at more than 10%+ discount to its expected cash reserve post the deal. The key here is simply how the company will utilize the cash, will they pay a huge dividend or invest the bulk of it or use a part of it for share repurchase .So a lot of unknowns &  uncertainty about the possibilities have resulted in the current valuation. I personally would prefer a share repurchase over dividend as this would avoid the unnecessary dividend distribution tax of about 16-17%. Although the management has already committed to paying a special dividend & also to get into the advance lighting systems business but the proportion of cash  for the same is unknown.It would be good if the company also repurchases some stock with a part of the money which is the best possible use of the cash given their capital allocation record. So a high Uncertainty but not necessarily a high risk special situation,would be interesting to see how it turns out. I am sure i would have missed some finer/obvious details, hence i  invite views.

Disclosure: Long Indo Asian Fusegear. Please read the Disclaimer

Monday, August 2, 2010

Swaraj Engines Update

I recently received the Annual report of Swaraj Engines for the year 2009-10. For a small cap company like SEL and in general for most Small & Micro caps there is so much information & insight one can draw from just the Annual Report. Further, SEL's website is pretty basic & worthless giving you hardly any idea about the company. A couple of readers were eager to know if it is the right time to invest in the stock after the recent run up in the prices. This post is an update on the performance of SEL in the last year & other insights if any that i was able to glean off the Annual report.

Performance in FY 2009-10

SEL registered total revenue of 295Crs last FY ,a growth of 37.34% Y-O-Y and it clocked Net profit of 37.35Crs an impressive 75.5% growth Y-O-Y. Net profit margin was 12.66% as compared to 9.9% last year. Return on Equity was a record high in 7 years at 30.4%. All this was mainly due to the fact that the company sold 39143 engines(28539 last year) a record high of all time and first time going above 100% capacity utilization of 36000 in recent years. More importantly the Free cash flow was 38.21 Crs after another year of abysmally low Capex of around 2Crs . So in the past 3 yrs Free Cash Flow has always been higher than the Net profits , that is a positive for me as very few companies are able to do that. So overall it was a great year for SEL and the management seems to be bullish about the long term prospects of the tractor industry without giving any specific guidance for the short term. The sales for Apr'10 were 41% higher than the previous year as per the annual report. As i mentioned in the previous post the number of farmers per tractor in India is quite a  bit above the global average and hence the long term story looks good .Although it can be hard to predict the short term trend given the vagaries of the sector. 

Valuation 

At the current Market price of 423 the stock is trading at a P/Ex of about 14 TTM and P/BV of 4.24 which on the face of it looks just about fairly valued. However the latest balance sheet shows that SEL's cash reserve's have grown over last year and it stands at 114.1 Crs(Cash & short term Investments). This is almost 22% of the current market cap & hence deducting the cash on books form the market cap the  new numbers for P/Ex & P/BVx are 10.9 and 3.3 respectively. Now the valuation appears more reasonable from a long term view. However i would like to buy under a P/Ex of 10 to get a margin of safety and this translates to a price of about 390. So personally i would buy more if the stock corrects to below 390 levels. One reader also asked me about the kind of returns one can expect in 3yrs or so. Honestly i don't have the answer and it all depends on how SEL performs as simple as that.As i am not buying at dirt cheap prices i expect SEL to be a compounder and not a multibagger(if everything goes as expected). So over the long run if bought at a reasonable price the returns will mirror the company's growth in profits(true for any stock in my opinion).

Other Observations

1. One of the risks that i seemed to have overlooked which i learnt through comments & discussions with others is that over 90% of SEL's revenue comes from M&M the parent company. This can both be a negative or a positive. There is a chance that the margins will come under pressure as it can't bargain much with M&M. However so far this hasn't been true and there hasn't been any drop in margins(it actually went up last year). Margins have stayed in the range of 10-13%. The positive is that they can have stable & predictive revenue and an efficient operating cycle(lower inventories,receivables etc). The latter is already reflected in the pristine Balance sheet & good cash flows.

2. A couple of senior officials of M&M led by Mr Pawan Goenka have been appointed to the board of SEL recently. Also there have been rumors about M&M's intent to buy out the stake of Kirlosker Oil Engines Limited in SEL. I believe all of this sends a strong signal about M&M's plans for SEL. Ever since M&M took over PTL the fortunes of SEL have turned around and the company has performed very well. It would be good for SEL if M&M can also use its facilities to manufacture other engines like for LCVs. This would remove its dependence on the Tractor Industry.Even otherwise the prospects appear good. SEL would soon need to undertake Capacity expansion given the rate at which they are growing. This can be easily funded through internal accruals given the cash on books & strong cash flows.

Sunday, June 13, 2010

The Business of Investing

I was recently having a chat with a few of my colleagues during lunch and  the topic of investing in a Flat/Plot(Real estate) came up during the discussion. Most of them easily concurred that its a very good idea to put lacs of rupees in Real estate as they would be assured of good returns. This mainly stemmed from the fact that most of our friends/senior or colleagues/relatives etc had made good money(multibaggers) in the last decade by investing in Real Estate.  The word 'investing' struck me and as i was an active investor in the stock markets, i spontaneously suggested that investing in Equity could also be an alternative matching the returns of Real Estate if not beat it. This statement of mine was immediately met with strong disagreement by my colleagues. They immediately said that investing in stocks was very risky and it was more or less gambling. Having invested in the markets for more than 1.5 yrs and having been an ardent follower of Benjamin Graham & Warren Buffett i tried defending my case by setting forth the basic fundamentals of Investing. There was nothing wrong with my colleagues  as such because they were just reiterating the same things that probably most people would say. Most of us have grown up being told by our parents,grandparents,relatives etc that stock markets are risky  and its better one stay away from them. However nothing could be further from the truth than this, lets understand why it is so.

I think the main reason for this kind of behavior is that most of us treat stocks like pieces of paper. A stock is simply put , a part of a business no more or no less. Hence Every stockholder of a company is a partner in that business and likewise eligible for dividends & voting. Just because you can buy and sell stocks at will and get a ticker showing second by second price changes doesn't mean it is pieces of paper one is trading. Also just because a stock is not a hard asset like Real estate or Gold doesn't mean it is more riskier than them. The simple fact about any investment be it gold,real estate or stocks is that you cannot make money if you pay a high price or in other words buy low sell high is what works. Just like buying a plot/flat requires us to think like house-owners,we should look at buying stocks like businessman. This is one of the key lessons i learnt early on upon reading 'The Intelligent Investor' where Ben graham repeatedly tries to drill this point home. A quote by Buffet is apt :


I am a better investor because I am a businessman and a better businessman because I am an investor.’


This is such an obvious fact but i am sure the majority of Dalaal /Wall street doesn't look at investing this way. Its a simple yet powerful idea that can change the way one looks at stocks. Do we ever rush and buy Real Estate without doing a decent amount of research & analysis?? Why shouldn't the same rule apply when buying a part of a business(stock) to ensure safety of capital & appreciation. Any Investment be it a hard or soft asset when done without any homework or by overpaying is bound to be risky & speculative. An asset class by itself is never risky inherently and investment  success depends on the amount of work put in and the price paid relative to the value.With respect to stocks sticking to Ben Graham's principle of looking at stocks as part ownership in a business can go a long way in ensuring capital protection and increasing the odds of capital appreciation. Having said that it is not an easy thing to do and many a times i have been swayed by rising and falling markets and behave speculatively rather than as a business owner would. It is simple but definitely not an easy thing to do(Taking a businessman like approach) but one can strive to get better at it by reading and building a circle of competence.  How do you all approach investing in stocks and view stocks in general?? Would love to hear from you all.

Wednesday, June 9, 2010

Swaraj Engines


Company Profile  


Swaraj Engines Limited (SEL) is a Mohali based company originally established to manufacture engines for the erstwhile Punjab Tractors Ltd(PTL).The Company was a joint venture between PTL and Kirloskar Oil Engines Ltd(KOEL).However  last year PTL was taken over by Mahindra & Mahindra(M&M) which is the market leader in Tractors(PTL was 3rd). SEL manufactures diesel engines, diesel engine components and spare parts. It supplies 5 types of Engines from 20HP range to 50HP range and also manufactures high-tech engine components for Swaraj Mazda.The Company’s engine business constitutes approximately 93% of its product revenue. The remaining 7% represents value of hi-tech engine components being supplied to SML for assembly of commercial vehicle engines.Let us dig deeper and determine whether SEL makes a good investment or not.

Balance Sheet Quality

A good business needs to be backed up by a good balance sheet just as a good foundation is required for a huge building.SEL has had a pretty strong balance sheet which has enabled it to weather the ups & downs of the business cycle quite well . The company had about 11.3Crs Debt or D/E of 0.28 in 2000 and was able to go debt free by around 2005. SEL has also managed short term assets and liabilities well having comfortable current ratios over the past 5 years. Also the Cash Conversion Cycle or the amount of time it takes for the company to get cash is -5 & has been negative throughout the 10 year period showing Management effectiveness in managing Creditors,Debtors & Inventory.So in short very little to worry about w.r.t the Balance sheet in the case of SEL. Lets now take a look at how the company has been making money and spending it.


Profitability


Having a good Balance sheet is no good if the company fails to utilize the assets in a productive way to grow sales & profits. Lets first take a look at how much the company spends and retains for each Rupee earned. The pie chart below shows the expenses and profit earned by SEL on average as a percent of sales(Over last 10 years).


As we can see the gross margins are around 22 % & it fell to 18.5% last year owing to rising raw material costs. The main raw material used is steel which is a commodity and its price keeps fluctuating which gets reflected in the gross margins of the company. However SEL has done remarkably well to control these costs & hasn't allowed the margin to fall below 22% over the past 10 years except in 2009 . The net profit margin(NPM) has averaged at about 12% again with 2009 being the worst year with 9.9% . The NPM only tells half the story and only when looked at in conjunction with the Asset Turns   do we get the complete picture as to how much the company returns on its assets. Asset turns has averaged about 2 taking the ROA to above 20%+ on average over the past 10 years. The chart below shows the Return on Equity (ROE) & Net Profit Margin(NPM) achieved by SEL over the last decade.


Cash Flow
Cash is King as they say and the cash flows of a company allow us to look at how much cash the company is actually making. Ultimately the company needs cash to pay dividends & reinvest in the business not EPS. A company having impressive sales & profits is no good if its not making any cash or burning cash. First lets look at how the Cash from Operations (CFO) compares with Earnings before Interest Depreciation & Amortization(EBIDA) , this is shown in the chart below (in Crs).


As we can observe the CFO follows the EBIDA reasonably well indicating that the Management hasn't been tinkering with Inventory, receivables & creditors to raise sales. Cash Flows are generally lumpy for most companies as can be seen from the chart whereas earnings are more smoother as companies tend to smoothen them over the business cycle by altering the revenue recognition. So now that we know SEL has had solid positive Cash Flows in the past lets look at how much of this cash the company is able to retain after capital expenditure(CAPEX) or in other words how much Free Cash Flow (FCF) it generates. The Chart below compares the Net profit vs FCF generated by SEL over the past 4 years(Had detailed Cash Flow statement for only last 4 years)(in Crs).


So SEL seems to be generating a good amount of Free cash and well above the net profits in the past 2 years. This is mainly owing to the low capital expenditures the company has incurred over the past few years. I am not sure of why this is so as it isn't evident from the annual report. However now after M&M has taken over we can expect some capacity expansion to happen which could increase the CAPEX many notches & FCF could take a hit. So the business has demonstrated a strong ability to generate good cash flows.

Performance and Management


We now have a fair idea about the Financial Stability,Profitability & Cash generating ability of Swaraj engines.Let us now delve into how SEL's sales & profits have grown over the years. The charts below show the sales & profits acheived by SEL over the last decade.


As is evident from the charts above SEL has had a pretty below average performance both wrt sales & profits between 2000-2009. Sales have grown at 4.6% CAGR & Profits at a disappointing 1.3% CAGR. If we observe carefully we can see that there was a slump in sales from 2000 to 2004-05 & then it picked up from 2005 onwards. However before jumping to conclusions it helps to know that the total tractor sales in India went downwards at 12.5% CAGR during the same period(2000-2004). As most of SEL's revenue came from supplying engines to Swaraj Tractors both the top-line & bottom-line took a hit. I was only able to get data for Tractor sales in India till 2006 & till then SEL had mirrored the movement of total tractor sales. However if we consider the past 5 years,Sales have grown by 18.3% CAGR & Net Profits by 15.5% as shown in the charts above. Further SEL has done well in FY2009-10 ,where Sales increased by 36% to a record 283Crs & net profit was up 76% at 37.4 Crs. So the business really seems to have picked over the past couple of years and actually did quite well even during the recession. The dividend Payout has been very healthy averaging about 48% although it has come down in recent years but still over 30%. The company missed the dividend only once in last 10 years in 2007. Considering the above factors it appears to me the management has done well (and is share holder friendly) to achieve good returns on invested capital although they could have done better on the revenue front.

Valuation


Now that we have looked into the financial statements and past performance of SEL it is time to check whether it is worth buying at current market prices. The simple rule of investing is buy low and sell high and there is no point overpaying for a company no matter how good it may be .  I am not going to try and value the company using DCF as i don't feel i have the requisite knowledge of the industry to make the right assumptions.So it would end up being Garbage in Garbage out, thats the reason i shall stick to common used valuation multiples.The table below shows the  Price by Earnings, Cash Flow & Book Value of SEL for the Trailing Twelve Months(TTM),normalized 3years & 5years earnings & cash flow.

                 TTM                  3yr Avg                  5yr Avg
P/E         10.43(8.4)           16.03(12.9)             19.15(15.41)  
P/CF       12.37(9.95)         13.78(11.09)           17.3(13.92)
P/BV       2.9


The values in the parentheses above show the valuation if we subtract 76.2Crs worth cash & investments from the market value or Rs 61.5/sh . So we are getting a zero debt company with average Cash Return on Capital Employed of over 30% for the past 5 years for a single digit P/E & P/BV of around 3. This may not be outright cheap but neither is it fairly valued especially if we look at the competition.  


Company                  MarketCap   P/BV(x)     P/E(x)     Div Yld    ROE(%)
Swaraj Engines Ltd          391            2.9            10.4         1.6          23.64
Cummins India Ltd         10,989         7.38           26.5        1.6          32.75
Greaves Cotton Ltd        1,663          4.32           41.4         1.2          11.89

The only competitors i could find were Cummins and Greaves cotton which are both engine manufacturers catering to different sectors though. Its generally a sector that has good margins and ROE and hence generally trade well over 2x of Book Value. So from a relative valuation standpoint also swaraj engines looks much cheaper.

Risks

Let me summarize the risks SEL faces in the following points.
  • As Most of SEL's revenue comes from Tractor engines its fortunes are tied to Tractor sales .The tractor industry has a certain cyclical nature and depends heavily upon the general rural economy – investments by the Government, monsoons and availability of credit at affordable rate.
  • The main raw material used is steel which is a commodity whose prices are cyclical which directly impacts the margins of the company
  • SEL also gets a part of its revenue from engine components of light commercial vehicles(LCV) which is a again a cyclical industry
  •  Again like IMPAL , this is also an illiquid stock and a smallcap although the Bid- Ask spreads and volatility are lesser than small/micro cap companies but more when compared to mid & large cap companies.
Conclusion

Though i am generally not a macro investor the investment thesis for SEL is more of a bet on the Agriculture sector.The Government has taken several initiatives towards addressing the major needs of the farm sector and to raise rural income. These initiatives include - enhanced credit, accelerated irrigation, marketing of agri-produce, enhancement of minimum support prices, up-gradation of farm technology etc. As a result, in the last six years, tractor market has grown by nearly 90%.Its no wonder then that ace indian investor Rakesh Jhunjhunwala seems to be bullish on the Agriculture sector in this recent interview . India has about 11 crore farmers in the country and  roughly 4.5 lakh tractors are sold every year and Tractor population is about 45 lakh. That means for every 22 farmers there is one tractor whereas the world average is 1 tractor for every 5.5 farmers. So  there is a good chance  that over the next few years the demand for tractors is going to be very buoyant.Also, the takeover by M&M, which  is the largest manufacturer of tractors in India and has sustained its market leadership in the Indian tractor market for over 26 years augurs well for SEL. The consolidated market share of the Farm Equipment Sector of M&M is now 40.9% of the domestic market.Swaraj Engines is also going to manufacture engines for the LCVs of Mahindra apart from Swaraj Mazda which will help increase non tractor revenue. Hence keeping the above factors in mind i think SEL makes a good long term bet .

Disclosure : Long Swaraj Engines.Please read the Disclaimer 

Tuesday, May 11, 2010

Stocks on Sale - 30% Off

In this current age of Malls & Supermarkets,we must all be accustomed to buying things ranging from consumer electronics to apparel at discounts. But how would you react if i said that i could tell you a way to buy stocks of two well known  companies at around 30% discount. The companies i am talking about are Tata Motors & Pantaloon Retail. However the instruments i am talking about here are Differential Voting Rights(DVR) shares rather than ordinary shares.They differ from ordinary shares in that they have different voting rights(higher/lower) and higher/lower dividends accordingly. In short these are devised for minority shareholders as Promoters,FIIs & DIIs generally don't like loosing their voting rights. So as an example, Tata Motor's DVR shares carry 1/10th voting rights but a 5% extra dividend over ordinary shares. DVRs have been quite unpopular in India with only the above mentioned companies issuing them.Lets take a more closer look at these instruments and try figuring out if they offer some kind of price mismatch that can be taken advantage of.

In 2008, Tata Motors had issued 6.41 crore shares as a part of its plan to raise Rs4,145 crore through a rights issue for repaying the loan taken for funding the acquisition of luxury brands Jaguar and Land Rover. The DVR shares were listed on the stock exchanges in November 2008. The ordinary rights issue was priced at Rs340 a share, while the DVR shares were priced at Rs305 a share.Due to the downturn in the markets at that time,the issue was heavily under-subscribed. The promoters led by Tata Sons had to bail out the issue by picking up the large unsubscribed portion(84%). Much of the balance was held by IFCI Ltd. As a result, there was hardly any floating stock and hence liquidity was low. Due to the low float, the DVR shares traded at a premium for some time and it was until IFCI and Tata Motors’ promoters offloaded some of their stake to institutional investors between September and November 2009 that they started trading at a large discount to the ordinary shares. Tata Motors’ promoter group now owns 53% of the DVR shares, down from 84.3% at the end of June 2009.Perhaps it was the possibility of more sales by the promoters that was keeping prices depressed. After all, it doesn’t make sense for promoters to hold shares with lower voting rights. Further there was a lot of uncertainty regarding the future of DVRs after the SEBI amendment of listing agreement clause 28A on July 2, 2009.The amended clause had specifically barred companies from issuing "in any manner which may confer on any person, superior rights as to voting or dividends vis-…-vis the rights on equity shares that are already listed". It was more a coincidence that Tata Motors DVRs came under the fold of the amended law as it was meant for thwarting the practice of issuing equity instruments by certain entities with "special conditions" to private equity players taking advantage of the provisions in the Companies Act. Hence due to the liquidity concerns and SEBI amendment both DVRs of Tata Motors & Pantaloon were trading at discounts as high as 43% in the first week of march.However as the chart below shows ,notice how the gap between the Ordinary shares of Tata Motors(TTM)  has dropped to around 30% from more than 40% in two months.


This can mainly be attributed to SEBI's recent informal guidance on Tata Motors DVR shares which has removed the legal uncertainty over it and paved way for free market valuation. The informal guidance specific to Tata Motors is legally enforceable and not only has it underlined the legal validity of the company's DVRs, but also allowed it to issue fresh DVRs with same terms by way of bonus or rights, follow on public issue, preferential allotment and qualified institutional placements and issue of employee stock options convertible into DVRs.I believe this augurs well for the DVR shares and one can expect this gap to come down to at-least 10% as globally DVRs trade at a 5-10% discount to ordinary shares. The globally well known behemoth owned by Warren Buffett - Berkshire Hathaway(BRK)  also has DVRs & surprisingly they trade at a negligible premium to ordinary shares.So assuming that  a 10% discount is fair for the DVRs that still leaves an upside of about 28% at today's closing price of Tata Motors(814) & DVR(570).This is provided the stock price of Tata Motors stays flat & the DVR's price rises. If however the Stock price  of Tata Motors moves up & down which is very likely the returns could be higher or lower.

Currently the discount between the Ordinary & DVR shares is about 30% both in case of Tata Motors and Pantaloon Retail. Another way to look at this is its a chance to own both business at a price 30% lower.This means i can get Tata Motors for a P/E of about 14 instead of 20 by buying DVR and also earn a   5% extra dividend. This makes a great case if one is bullish on Tata Motors a company i feel is a little hard to analyze given its complexity, all-though a multiple of 14 doesn't look too expensive for a company of this size & reputation if the much hyped Auto boom is to come. The same logic applies to Pantaloon,however its one of those growth stocks i try to keep away from given its lofty valuations and i would do that even after a 30% discount. In short this could be a high risk bet with returns of around 30%+ if it works out which i feel is not bad at all at current market levels. This is my first attempt at special situations investing so i am sure i might have left overlooked some vital points and nitty-gritties. Please let me know what you all think, would love to have a discussion on this post.


Source of Idea : This article by Livemint  shared by Bikram .


Disclosure : Long DVR shares of Tata Motors & Pantaloon(tiny position) . I bought these in early march when the discount was about 43% .